Sparse Classification
The demo in this tutorial can be obtained by running pyGPs/Demo/demo_GPC_FITC.py. This demo is more or less a repetition of the demo of FITC regression.
First example  default inducing points
First load the same data as in the GPC demo.
[Theory]
In case the number of training inputs  exceeds a few hundred, approximate inference using Laplacian Approximation or Expectation Propagation takes too long. As in regression, we offer the FITC approximation
based on a low-rank plus diagonal approximation to the exact covariance to deal with these cases. The general idea is to use inducing points
 and to base the computations on cross-covariances between training, test and inducing points only.
Okay, now the model is FITC classificiation:
model = pyGPs.GPC_FITC()
The difference between the usage of basic  is that we will have to specify inducing points.
In our first example, we will introduce how to perform sparse GPC with the default settings.
The default inducing points form a grid (hypercube in higher dimension), where each dimension has  values in equidistant steps in
 ,
where
 and
 are the minimum and maximum values of the input data by default.
In order to specify the dimension of input data, we HAVE TO set data first:
model.setData(x, y)
The number of inducing points per axis is per default. How to change this, see A bit more things you can do.
Then, the regular process follows:
model.optimize()
model.predict(z, ys=np.ones((z.shape[0],1)))
model.plot(x1,x2,t1,t2)
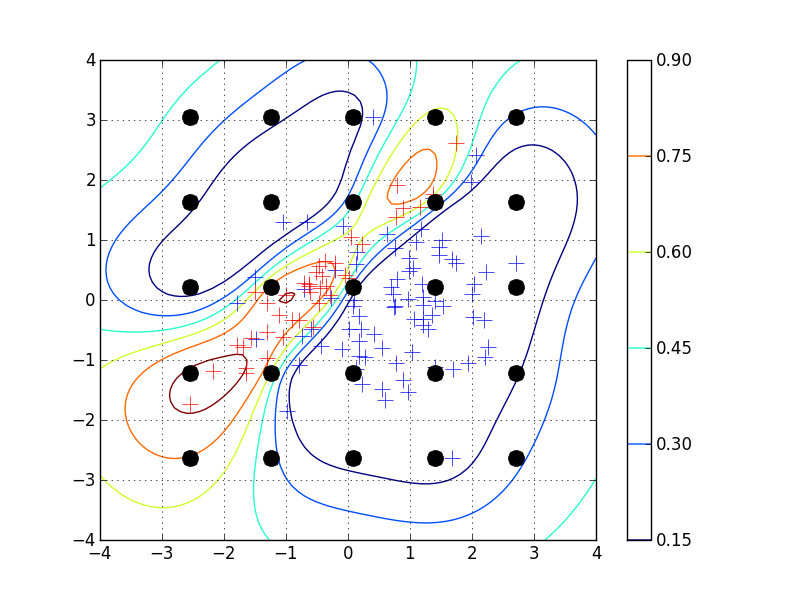
The equispaced default inducing points are shown as black circles in the plot.
Second example user-defined inducing points
Alternatively, a random subset of the training points can be used as inducing points. Note, that there are various different ways of how to set the inducing points. So, in the second example let us use a user-defined set of inducing points:
u1,u2 = np.meshgrid(np.linspace(-2,2,5),np.linspace(-2,2,5))
u = np.array(zip(np.reshape(u2,(np.prod(u2.shape),)),np.reshape(u1,(np.prod(u1.shape),))))
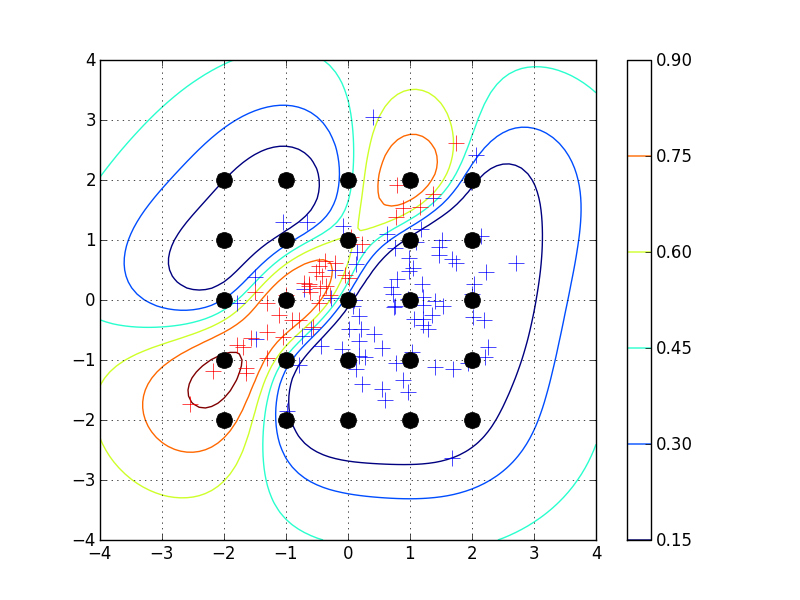
Here, we also use a grid euqually spaced, but without the values on the margin of the grid.(i.e. shrinking the grid) Then, we can just pass when specifying prior:
m = pyGPs.mean.Zero()
k = pyGPs.cov.RBFard(log_ell_list=[0.05,0.17], log_sigma=1.)
model.setPrior(mean=m, kernel=k, inducing_points=u)
The prediction results for this set of inducing points are shown below:
A bit more things you can do
As in standard GPC, it is possible to use other inference/likelihood in the FITC method:
model.useInference("Laplace")
Change the number of inducing points per axis:
model.setData(x, y, value_per_axis=10)